Visualizing Risk: The True Frequency Of Airplane Near Misses And Crashes

Table of Contents
The Perception of Risk vs. Reality in Air Travel
The Psychology of Fear
Our perception of risk is often distorted by cognitive biases. The availability heuristic, for example, makes us overestimate the likelihood of events that are easily recalled, such as plane crashes prominently featured in news headlines. The negativity bias further amplifies this effect, making negative events seem more impactful than positive ones.
- News coverage: Sensationalized reporting of plane crashes, even rare ones, disproportionately influences public perception, creating a skewed sense of risk.
- Emotional impact: The emotional weight of a single, tragic plane crash overshadows the millions of safe flights that occur daily, reinforcing a fear that isn't statistically justified.
Statistical Reality of Air Accidents
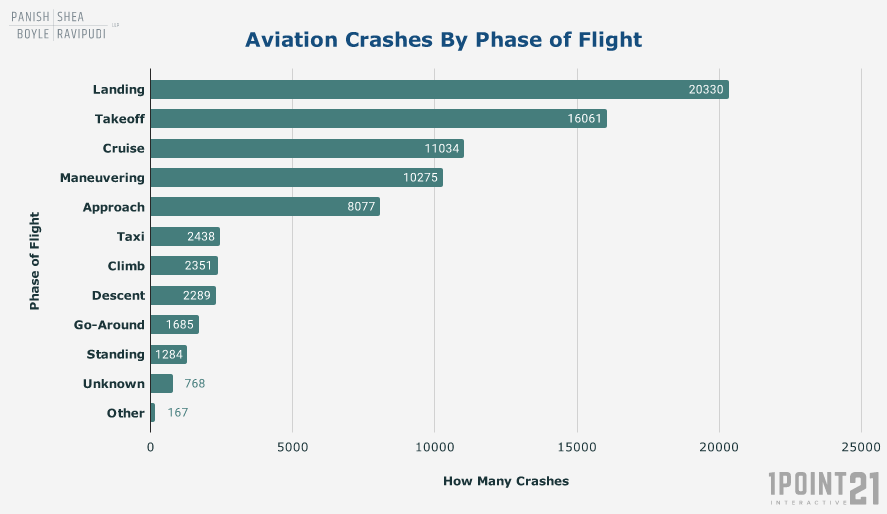
The reality is far different from the perceived risk. Globally, the number of airplane crashes and near misses per year, relative to the sheer volume of flights, is remarkably low. Visualizing this data through charts and graphs helps to put the risk into perspective.
- Accident rates: Major aviation safety organizations consistently report extremely low accident rates per million flights, highlighting the exceptional safety record of the aviation industry.
- Comparative safety: Compared to other forms of transportation like driving or train travel, air travel boasts significantly lower accident rates per passenger mile.
Understanding the Data Behind Near Misses
Defining "Near Miss"
In aviation, a "near miss," or more accurately a "hazardous incident," refers to an event that could have resulted in an accident but was avoided through timely action. These incidents encompass a range of severities.
- Types of near misses: Examples include runway incursions (aircraft coming dangerously close to colliding on the runway), loss of separation (aircraft getting too close to each other in flight), and bird strikes (birds impacting an aircraft).
- Reporting mechanisms: Robust reporting systems are crucial. Pilots, air traffic controllers, and maintenance personnel are encouraged to report near misses, allowing authorities to identify patterns and implement preventative measures.
Analyzing Near Miss Data
Aviation authorities, such as the Federal Aviation Administration (FAA) in the US and the International Civil Aviation Organization (ICAO) globally, meticulously collect and analyze near-miss data. This analysis is critical for improving safety.
- Data collection and analysis: These organizations employ sophisticated methods to identify trends, contributing factors, and potential systemic weaknesses within the aviation system.
- Safety improvements: Investigations into near misses often lead to changes in procedures, technologies, and training protocols, directly enhancing safety and preventing future accidents.
Visualizing the Data: Charts and Graphs for Better Understanding
Creating Visual Representations
Effectively visualizing aviation safety data requires careful selection of chart types. Bar charts can compare accident rates across different years or regions, while line graphs can track trends over time. Maps can geographically represent incident locations.
- Clear and concise visuals: Data visualizations should be designed for maximum clarity and ease of understanding, avoiding unnecessary complexity.
- Interactive visualizations: Interactive dashboards allow users to explore the data more deeply and personalize their analysis. For example, interactive maps can allow users to zoom into specific regions or filter data by aircraft type.
Interpreting Visual Data
Visualizations are powerful tools for dispelling misconceptions. However, proper interpretation requires attention to context and scale.
- Context and scale: Understanding the scale of the data (e.g., number of flights, passenger miles) is crucial for accurately interpreting risk.
- Dispelling misconceptions: Visualizations can clearly demonstrate the exceptionally low probability of being involved in a plane crash, helping to alleviate unfounded fears.
Conclusion: Visualizing Risk and Maintaining Perspective on Air Travel Safety
The data overwhelmingly demonstrates that airplane crashes and near misses are exceedingly rare events. Understanding the statistical reality of air travel safety, aided by effective data visualization, allows for a more balanced and realistic risk assessment. By actively seeking out reliable sources of aviation safety data and visualizing this information for themselves, individuals can gain a clearer understanding of the true frequency of airplane near misses and crashes. Explore resources from the FAA, ICAO, and other reputable aviation safety organizations to further your understanding of this vital topic and continue visualizing risk effectively.

Featured Posts
-
 Shareholders Approve All Resolutions At Imcd N V Annual General Meeting
May 24, 2025
 -
 Mia Farrows Warning Trump Congress And The Future Of American Democracy
May 24, 2025
 -
 Al Roker And Co Host Clash Following Private Conversation Disclosure
May 24, 2025
 -
 Young Hawaiian Artists Shine Memorial Day Lei Poster Contest
May 24, 2025
 -
 Peredbachennya Konchiti Vurst Schodo Peremozhtsiv Yevrobachennya 2025
May 24, 2025
Latest Posts
-
 Lowest Gas Prices In Years Expected For Memorial Day Weekend
May 24, 2025
 -
 Ocean City Rehoboth And Sandy Point Beach Weather Memorial Day Weekend 2025 Forecast
May 24, 2025
 -
 Official Kermit The Frog Speaks At University Of Maryland Commencement 2025
May 24, 2025
 -
 University Of Marylands Unexpected 2025 Commencement Speaker Kermit The Frog
May 24, 2025
 -
 Kermit The Frog To Address Umd Graduates In 2025 Social Media Response
May 24, 2025
