Amundi Dow Jones Industrial Average UCITS ETF: A Guide To Net Asset Value (NAV)

Table of Contents
What is Net Asset Value (NAV) and Why is it Important?
Net Asset Value (NAV) represents the value of an ETF's underlying assets per share. Simply put, it's the total value of all the stocks, bonds, or other assets held within the ETF, minus any liabilities, divided by the number of outstanding shares. This figure reflects the intrinsic worth of the ETF.
Understanding NAV is paramount for several reasons:
- Informed Decision-Making: NAV provides a clear picture of the ETF's true value, allowing you to compare it against its market price. This helps you identify potential bargains or overpriced situations.
- Performance Evaluation: Tracking changes in NAV over time reveals the ETF's performance, enabling you to assess its growth potential and compare it to other investments in your portfolio.
- Pricing Transparency: NAV plays a vital role in determining the buying and selling prices of the ETF shares. While market prices fluctuate throughout the day, the NAV provides a benchmark for the ETF's fair value.
How is the NAV of the Amundi Dow Jones Industrial Average UCITS ETF Calculated?
The NAV of the Amundi Dow Jones Industrial Average UCITS ETF is calculated daily by Amundi, the fund manager. The process involves:
- Determining the market value of each component: The ETF tracks the Dow Jones Industrial Average (DJIA), so the value of each of the 30 constituent companies is determined at the end of the trading day.
- Calculating the total value of the underlying assets: The market values of all 30 DJIA components are aggregated to determine the total portfolio value.
- Deducting expenses: Any management fees, administrative expenses, or other applicable costs are subtracted from the total asset value.
- Dividing by the number of outstanding shares: The resulting net asset value is then divided by the total number of outstanding ETF shares to arrive at the NAV per share.
Key Steps in Amundi Dow Jones Industrial Average UCITS ETF NAV Calculation:
- Daily market value assessment of DJIA components.
- Aggregation of component values.
- Deduction of management fees and expenses (expense ratio).
- Division by outstanding shares to determine NAV per share.
Where to Find the Daily NAV of the Amundi Dow Jones Industrial Average UCITS ETF?
You can find the daily NAV of the Amundi Dow Jones Industrial Average UCITS ETF from several reliable sources:
- Amundi's official website: The fund manager usually publishes the daily NAV on its investor relations section.
- Financial news websites: Major financial news providers often include ETF NAV data in their market information sections.
- Brokerage platforms: Your brokerage account will display the NAV of any ETFs you hold in your portfolio.
The NAV is typically updated at the close of the market, reflecting the end-of-day values of the underlying assets. It's important to note that the market price of the ETF might differ slightly from the NAV due to intraday trading activity.
Using NAV to Make Informed Investment Decisions
NAV is a powerful tool for informed investment decisions. By analyzing the NAV alongside the market price, you can:
- Identify undervalued ETFs: If the market price is significantly below the NAV, it could indicate an attractive buying opportunity.
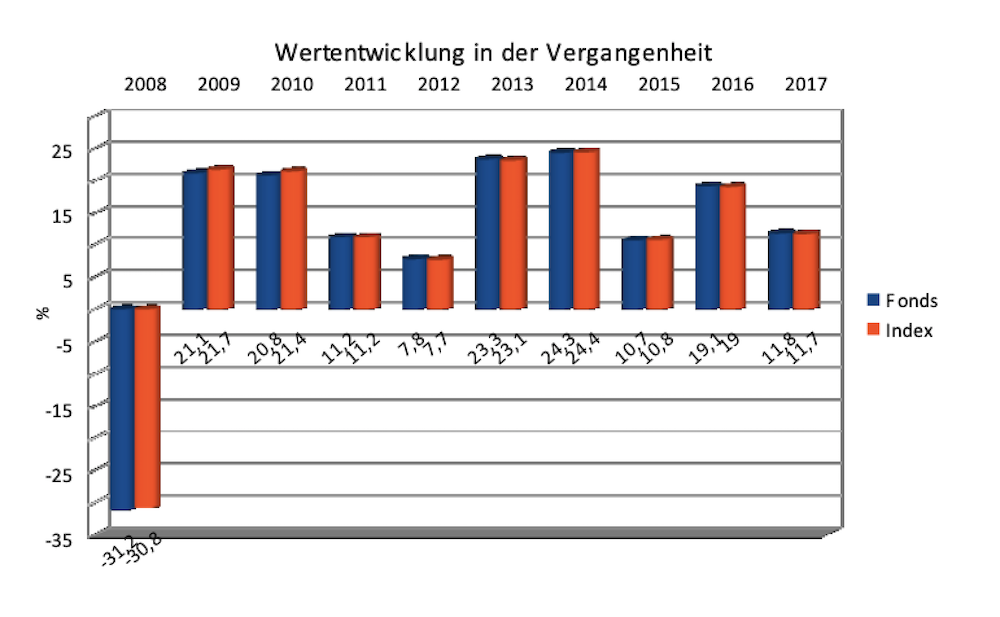
- Track performance against benchmarks: Comparing the NAV's growth to the DJIA's performance allows you to assess the ETF's efficiency in tracking its benchmark.
- Assess risk and return: Understanding NAV fluctuations can assist in your risk assessment and help you make decisions aligned with your investment goals and risk tolerance.
- Optimize portfolio allocation: NAV data helps you evaluate the relative value of the Amundi Dow Jones Industrial Average UCITS ETF within your broader investment portfolio, allowing for strategic adjustments.
For example, a consistent decline in NAV might suggest a need for diversification or a reevaluation of your investment strategy.
Conclusion: Mastering the Amundi Dow Jones Industrial Average UCITS ETF's NAV
Understanding the Net Asset Value (NAV) of the Amundi Dow Jones Industrial Average UCITS ETF is crucial for making sound investment decisions. By consistently monitoring the NAV and comparing it to the market price and the performance of the underlying Dow Jones Industrial Average, you can gain a deeper understanding of the ETF's value and potential. Learn more about the Amundi Dow Jones Industrial Average UCITS ETF's Net Asset Value today! Start making informed investment decisions using the Amundi Dow Jones Industrial Average UCITS ETF's NAV and enhance your portfolio management strategy.

Featured Posts
-
 Seattles Urban Parks Providing Refuge During Covid 19
May 24, 2025
 -
 Frances National Rally Le Pens Sunday Demonstration Falls Short Of Expected Show Of Force
May 24, 2025
 -
 Apple Stock Slumps 900 Million Tariff Impact
May 24, 2025
 -
 Amsterdam Exchange Plunges 2 Drop After Trumps Tariff Announcement
May 24, 2025
 -
 Vozrast Geroev Filma O Bednom Gusare Zamolvite Slovo Podrobniy Analiz
May 24, 2025
Latest Posts
-
 Buffetts Apple Investment Navigating The Impact Of Trump Era Tariffs
May 24, 2025
 -
 Apple Vs Trump Tariffs Will Buffetts Top Tech Stock Crack
May 24, 2025
 -
 Apple Stock Price Drops On 900 Million Tariff Announcement
May 24, 2025
 -
 Apple Stock Suffers Setback Amidst 900 Million Tariff Projection
May 24, 2025
 -
 Apple Stock Slumps 900 Million Tariff Impact
May 24, 2025
